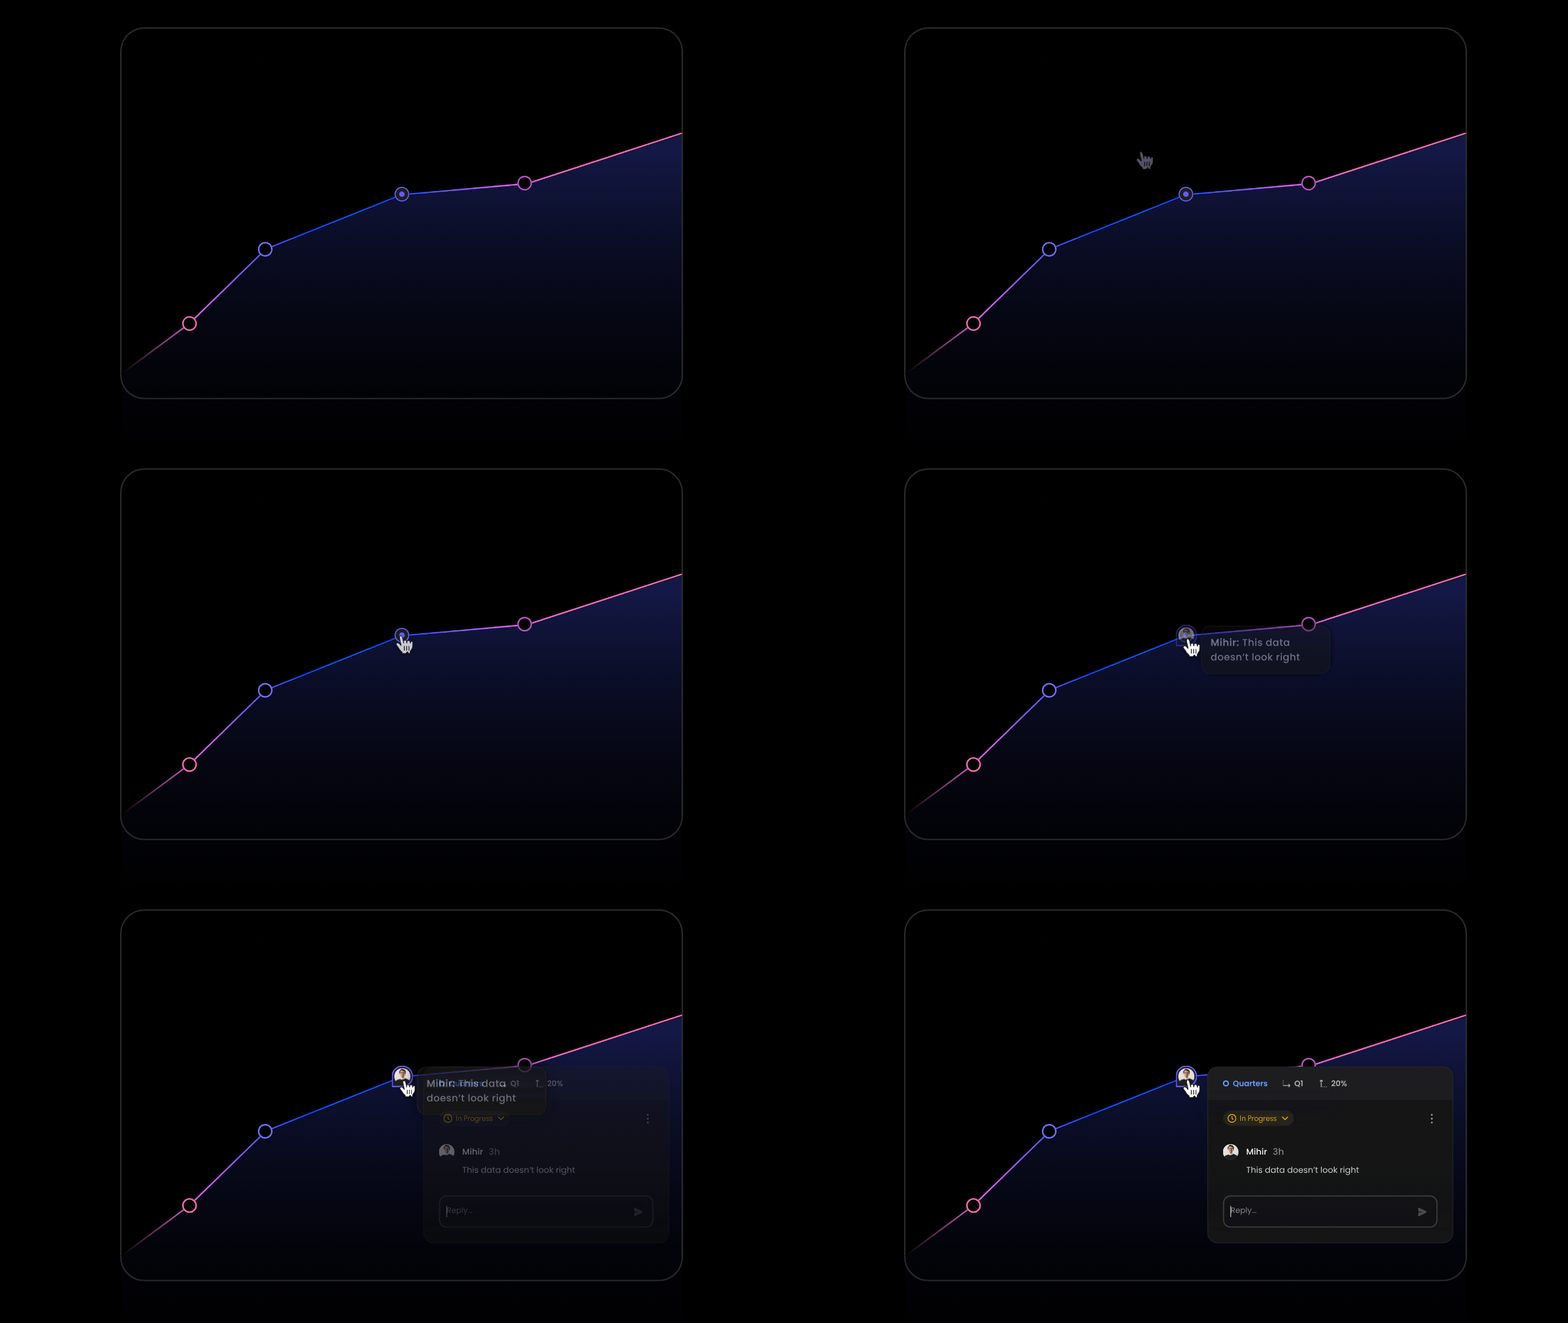
1

Import components from Nivo Charts

import { ResponsiveLine } from '@nivo/line';
2

Import VeltNivoChartComments component from Velt

  • Add VeltComments once to the root of your app. This component is required to render comments in your app.
import { VeltNivoChartComments, VeltComments } from '@veltdev/react';
3

Add a container div for the Nivo Chart component

  • Add a nivo-chart-container class to it. This will help us position the Velt Comment Pins accurately.
<div style={{ height: 400, width: '100%' }} className='nivo-chart-container'>
  <ResponsiveLine
    data={data}
    layers={[ 
        'grid', 'markers', 'axes', 'areas', 'crosshair',
        'lines', 'slices', 'legends', 'points',
    ]}
    />
</div>
4

Add VeltNivoChartComments to the Nivo Chart component

  • Add a custom function as a layer inside your Nivo Chart component and return VeltNivoChartComments component.
  • Set a unique id in the VeltNivoChartComments component to scope comments to the specific chart, isolating them from other charts.
  • Pass the chartComputedData props to it.
<ResponsiveLine
  data={data}
  layers={[ 
    'grid', 'markers', 'axes', 'areas', 'crosshair',
    'lines', 'slices', 'legends', 'points',
    // Add this function with VeltNivoChartComments
    // component to allow Velt comments inside the Chart
    (chartComputedData) => {
        return (
            <VeltNivoChartComments id="NivoLineChartExample" chartComputedData={chartComputedData} />
        )
    }
  ]}
/>
5

(Optional) Customize the Chart Metadata displayed in the Comment Dialog

  • Pass an array to the dialogMetadataTemplate prop in the VeltHighChartsComments component.
  • This array determines the chart metadata displayed in the comment dialog, representing the data point (e.g., x-axis and y-axis values) on which the comment was added.
  • Customize the order of the keys or remove unnecessary keys to control how the metadata is presented in the comment dialog.

Default: ['groupId', 'label', 'value']

For example:

<VeltNivoChartComments
  id="NivoLineChartExample"
  chartComputedData={chartComputedData}
  dialogMetadataTemplate={['label', 'value', 'groupId']} />